SoundStats (v1.1.2)
by Alexander Thomas (aka Dr. Lex)
What is it?
This program analyses sound files and outputs the following information:
- the length of the file(s),
- the minimum (most negative) and maximum (most positive) sample value,
- the maximum number of consecutive samples that clip,
- the total percentage of samples that clip in the file,
- the effective number of bits required to represent the files when quantised to 16-bit integers,
- the most occurring sample value,
- the average power assuming that the sound is played through a purely resistive loudspeaker of 1 Ω with the minimum and maximum 16-bit sample values corresponding to respectively -1 and 1 Volts,
- the ReplayGain adjustment,
- a histogram of how often a stretch of continuous samples clips,
- a histogram of how often each sample value occurs.
The histograms, either stereo or mono, can be printed as ASCII art on the console, or saved to tab-delimited text files for further processing.
Why this program?
SoundStats can be useful for various applications in sound and music, but the main reason why I wrote it is to see how badly some recent music albums are mastered thanks to the infamous Loudness Wars. The most important statistics that this program outputs in that respect are the clipping statistics, the sample value histogram, and the ReplayGain value. If you're going to analyse a typical original CD from the eighties, you will see that it:
- almost never has clipping samples and uses an effective number of bits somewhere in between 15 and 16,
- has a logarithmic sample value histogram that is mostly pyramid-shaped (or diamond-shaped in SoundStats' stereo display),
- has a ReplayGain value mostly between -6dB and 0dB.
SoundStats prints a logarithmic histogram, which implies that if is diamond-shaped (i.e. it falls off linearly) the distribution of amplitudes itself is exponential. This is not a coincidence because that is also the distribution of many naturally occurring sounds. If one would make a raw recording of a live band or orchestra, chances are that it will have a similar distribution. Therefore, by reproducing the audio such that it maintains the same distribution it will still sound ‘live’ in all meanings of the word.
However, when analyzing many recent albums you will see something more like in the screenshot above, or worse: one big lump that comes closer and closer to a uniform distribution with more recent releases. Clipping also becomes considerable. The ReplayGain value will often go below -10dB. The reason why this is the case and why this is generally bad is explained in my article on the Loudness Wars and in the ReadMe file included with SoundStats.
Compiling and using
SoundStats is a basic console command written in C++ and uses only standard libraries, plus optionally supports OGG Vorbis and MP3 through libMAD. Support for WAV and AIFF is built-in. I do not provide precompiled binaries because I really don't have the time to provide support for a gazillion different architectures, therefore you need to compile it yourself. The easiest way to compile is to use CMake with the included CMakeLists.txt file. Or, you can manually tweak the included Makefile. Read the included INSTALL file for more details.
Built-in help can be invoked with the ‘-h’ switch.
If anyone feels like wrapping this into a neat Linux/OS X/Windows package with GUI, feel free. As you can see below, this program is released under the New BSD License.
Download
Download the source code (bzip2 compressed tar archive)
Read the included README.txt for more details.
In a nutshell
For those who want to get a quick idea of what to expect from the output of this program without going through the entire README file, here is an overview.
First of all, look at the “Clipping histogram”. If there is none, then there is no clipping, unless the person mastering the album was really devious and made the sound waves clip at a lower level. The most important thing about the clipping histogram if there is one, is the “range” number. If it is 10 and the entries hog the left of the display (or center for stereo display), then the histogram is shown as-is without scaling and there is no clipping worth talking about. If the range starts reaching large numbers in the thousands or if there are entries far away from the left (or center), there is considerable clipping.
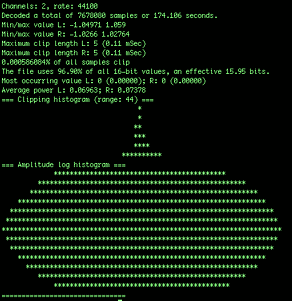
Next, look at the “Amplitude log histogram”. If it looks like a triangle (or diamond in stereo display), the album is mastered in a way that sounds ‘natural’ and it should not be fatiguing during prolonged listening. If it looks like a fat lump that extends far to the right, the album is poorly mastered, the songs will lack dynamic range, and it will be fatiguing to listen to. Here's the histogram for the original release of the Peter Gabriel album “So” (at the left), and the Red Hot Chili Peppers album “Californication” (at the right).
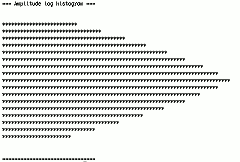
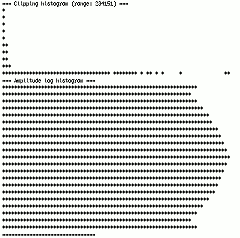
As you can see, ‘So’ has no clipping at all and shows a near perfect triangle. It has a ReplayGain value of -1.74dB. ‘Californication’ has a clipping histogram that peaks at 234151. It has continuous stretches of clipping samples as long as 118, or 2.7 milliseconds, which is very audible. To top it off, it has a ReplayGain value of -12.77dB, which means the volume needs to be turned down by 11dB to make the album play at the same perceived loudness as ‘So’. Therefore it has 11dB less headroom to produce interesting variations in amplitude.
These are just general rules of thumb, and obviously only apply to music that is supposed to sound ‘natural’. For stuff like thumping hardcore techno or death metal, you should expect histograms that look even more extreme than the one on the right. There would be nothing really wrong with that because dynamic range is not something such styles of music strive for.
Disclaimer
SoundStats is released under the New BSD License. This software is provided “as is”, without any implied warranty or claim of fitness for a particular purpose. Use of this software is completely at your own risk.